Understanding customer purchasing behavior is essential for businesses looking to optimize sales and enhance customer experience. This article presents a brief analysis of sales data from the bakery Tartine & Bonne Humeur, focusing on customer segmentation and purchasing habits. By leveraging data analysis and machine learning techniques, I explore key sales patterns, identify factors influencing revenue, and develop a basic predictive model to forecast future sales. This study provides a snapshot of how data-driven insights can help small businesses refine their strategies, with methodologies ranging from data preprocessing to clustering and sales forecasting.
Dataset creation and preprocessing
The dataset was built using sales data from the bakery's point-of-sale (POS) system. The raw data was exported and cleaned to ensure usability. It includes transactions recorded from September 2020 to the present, stored in a CSV file where each row represents a product sold within a transaction.
The first step in data preparation involved cleaning the dataset by removing anomalous entries, such as transactions with negative prices or quantities. Refunds were also excluded, as they share the same transaction reference but appear with negative quantities.
Each transaction contains details such as the product sold, quantity, unit price, transaction date, product category, and other relevant attributes. This structured dataset serves as the foundation for further analysis of sales trends and customer purchasing behavior.
Sales analysis and customer segmentation
Understanding sales distribution is crucial for identifying key revenue drivers and customer preferences. To gain insights into purchasing behavior, I first examined the best-selling product categories. This allowed me to determine which types of products contribute most to the bakery's overall sales.
The following graph illustrates the revenues generated by all product categories :
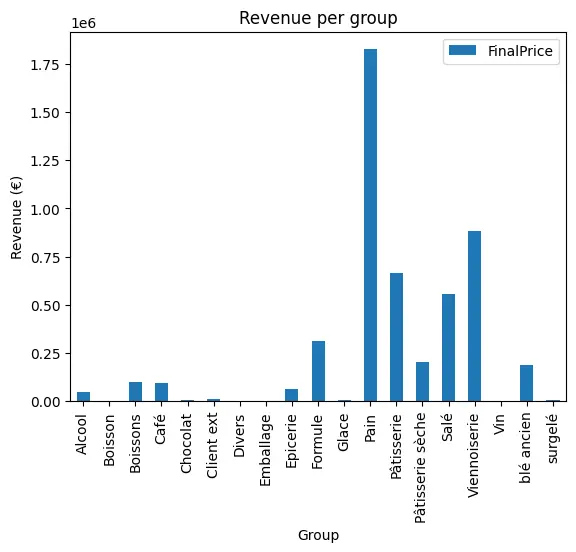
As observed, bread, pastries, and viennoiseries dominate the sales, confirming their role as the bakery’s core offerings. This result aligns with expectations, as these products are staple items for most customers. However, breaking down sales by category also helps identify secondary product lines that contribute to revenue.
Beyond overall sales volume, I further investigated consumption patterns by analyzing how customers combine different products within a single transaction. This deeper exploration of purchasing behavior serves as a foundation for customer segmentation and targeted marketing strategies.
Analysis of Consumer Behavior
To gain a deeper understanding of customer purchasing habits, I examined how different products are combined within a single transaction. Rather than analyzing individual product sales in isolation, I focused on grouping items that were purchased together. This approach provides a more comprehensive view of consumer behavior and helps identify recurring purchasing patterns.
To achieve this, I restructured the dataset by consolidating transactions. I first extracted the complete list of products sold and created a new dataset where each row represents a unique transaction. In this format, the dataset includes a column for the transaction date and a separate column for each product sold, totaling 272 columns. I then grouped the data by transaction reference and summed the quantities of each product within the same purchase. As a result, each row encapsulates a customer’s full order, allowing for a more detailed exploration of buying behaviors.
This transformation made it possible to identify which products are frequently purchased together. Such insights are valuable for optimizing product placement, designing targeted promotions, and improving inventory management. Understanding these consumption habits can help businesses tailor their offerings to customer preferences, ultimately enhancing the overall shopping experience.
Determining the Optimal Number of Clusters Using the Elbow Method
To segment transactions into distinct customer purchasing patterns, I applied a clustering approach. The first step in this process was to determine the optimal number of clusters. For this, I used the Elbow Method, which evaluates how the variance within clusters decreases as the number of clusters increases.
The Elbow Method calculates the within-cluster sum of squared errors (WCSS), which is defined as:
where:
- is the number of clusters,
- represents a cluster,
- is a data point in cluster ,
- is the centroid of cluster ,
- is the squared Euclidean distance between each point and its cluster centroid.
By plotting the WCSS against different values of , we can identify the point where adding more clusters no longer significantly reduces the WCSS. This inflection point is called the elbow, as it resembles a bend in the curve.
The following graph illustrates the results of the Elbow Method:
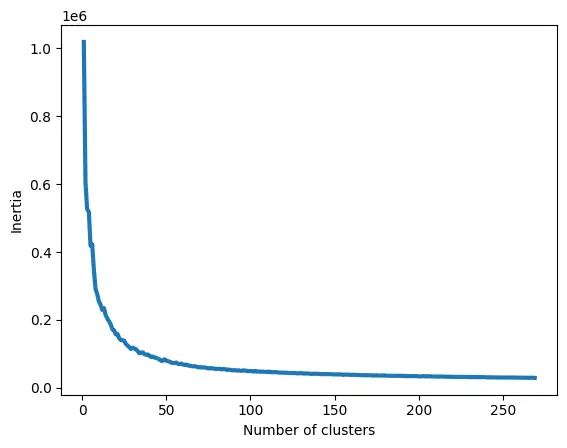
As observed, the elbow occurs around k = 60, suggesting that 60 clusters provide a good balance between capturing meaningful patterns and avoiding excessive complexity. This value was then used for the clustering process in the subsequent analysis.
Clustering with K-Means
Once the optimal number of clusters was determined using the Elbow Method, I applied the K-Means algorithm to segment transactions based on purchasing patterns. K-Means is an unsupervised machine learning algorithm that partitions data into clusters by minimizing the sum of squared distances between each point and its assigned cluster centroid.
The algorithm follows an iterative process:
- It randomly initializes cluster centroids.
- Each data point is assigned to the nearest centroid.
- The centroids are recalculated based on the new cluster assignments.
- Steps 2 and 3 are repeated until the centroids stabilize or a predefined number of iterations is reached.
To visualize the clusters, I performed Principal Component Analysis (PCA) to reduce the data’s dimensionality to three components and plotted the results in a 3D space:
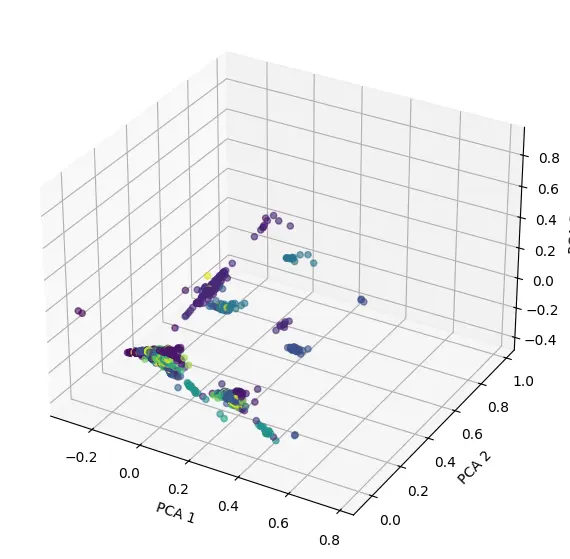
Due to the high dimensionality of the data (272 features corresponding to different products), the visualization is limited in accurately representing all cluster separations. However, the presence of distinct groupings suggests that customers exhibit clear purchasing patterns, reinforcing the validity of the clustering approach.
These clusters serve as a foundation for further analysis, including personalized recommendations and targeted marketing strategies based on consumer behavior.
Purchase Prediction
Based on the identified clusters, a predictive model was developed to estimate the likelihood of purchasing specific items given an initial set of products. This model leverages the inherent structure of consumer behavior as inferred from clustering analysis, aiming to predict future purchases contingent upon observed patterns. The prediction function, designed to be computationally efficient, accepts a list of items already acquired and outputs the estimated quantity for each additional product likely to be purchased.
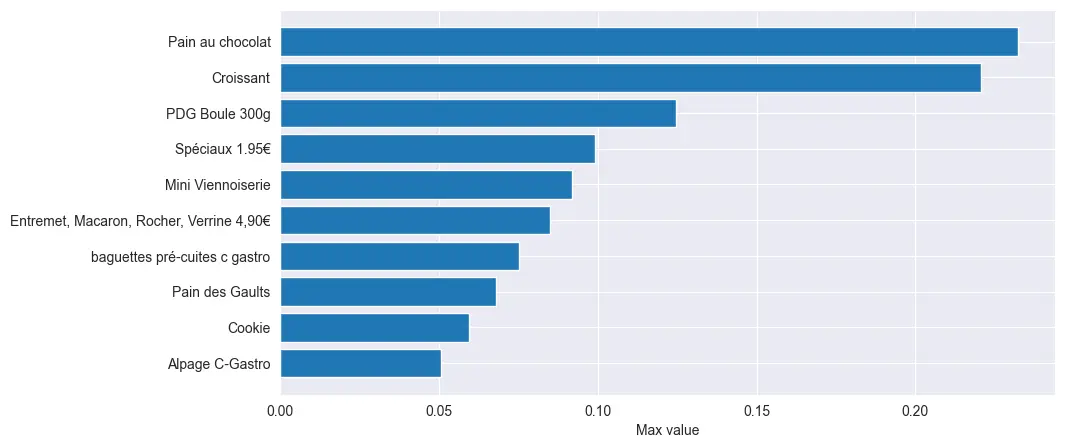
For instance, empirical analysis revealed that a customer purchasing a traditional baguette is statistically expected to also acquire approximately 0.23 pain au chocolat and 0.22 croissant on average. Conversely, customers selecting coffee as a primary product exhibit a preference for viennoiseries, as evidenced by the increased probability of purchasing a croissant (0.35) and a pain au chocolat (0.31), while the traditional baguette ranks fifth with an estimated frequency of 0.05. These results suggest a clear differentiation in purchasing behavior based on the initial item choice, highlighting a nuanced segmentation of consumer preferences.
The observed recurrent presence of the same top products across various purchasing contexts may indicate robust and entrenched consumption patterns. However, it is crucial to account for product seasonality, as many items are available only during specific periods (e.g., Christmas, Easter). Consequently, despite the substantial diversity in the product catalog, the day-to-day assortment is more restricted, contributing to the consistency observed among frequently purchased items.
Analysis of Price Increases
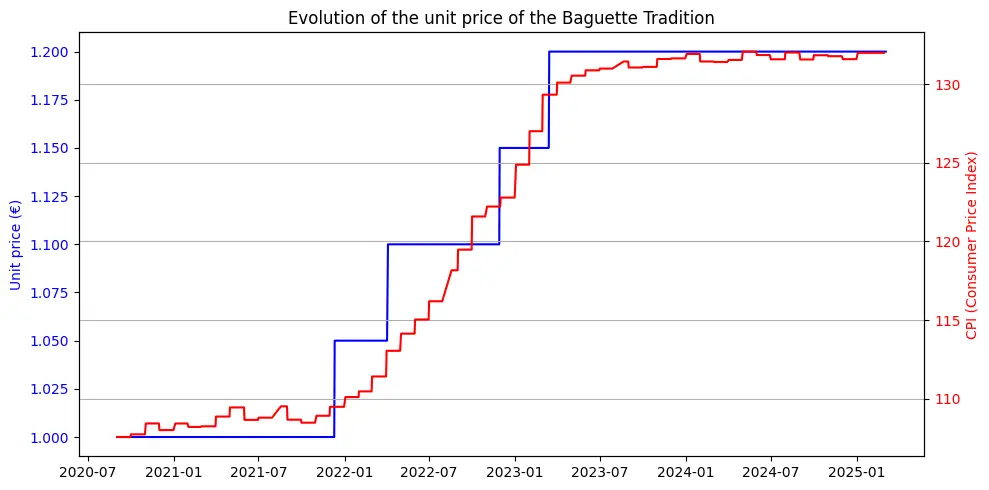
To assess the evolution of product pricing, we focused on the unit price variations of traditional baguettes over time. The primary objective was to identify external factors correlated with price adjustments and evaluate their respective impacts. Among the factors investigated, the most significant correlations were found with the Consumer Price Index (CPI) for food and the cost of energy.
The CPI for food exhibits a strong positive correlation with the unit price of traditional baguettes, suggesting that macroeconomic trends in food prices significantly influence bakery pricing strategies. The temporal alignment between the rising CPI and the increasing cost of baguettes supports the hypothesis that inflationary pressures in the food sector contribute to the observed price adjustments. This relationship is clearly illustrated in the following graph:
Energy costs also appear to influence bakery pricing, albeit with a certain temporal lag. This lag is likely attributable to the nature of fixed-term energy contracts, which can delay the impact of energy price fluctuations on production costs. Nevertheless, the long-term correlation remains evident, as shown in the graph below:
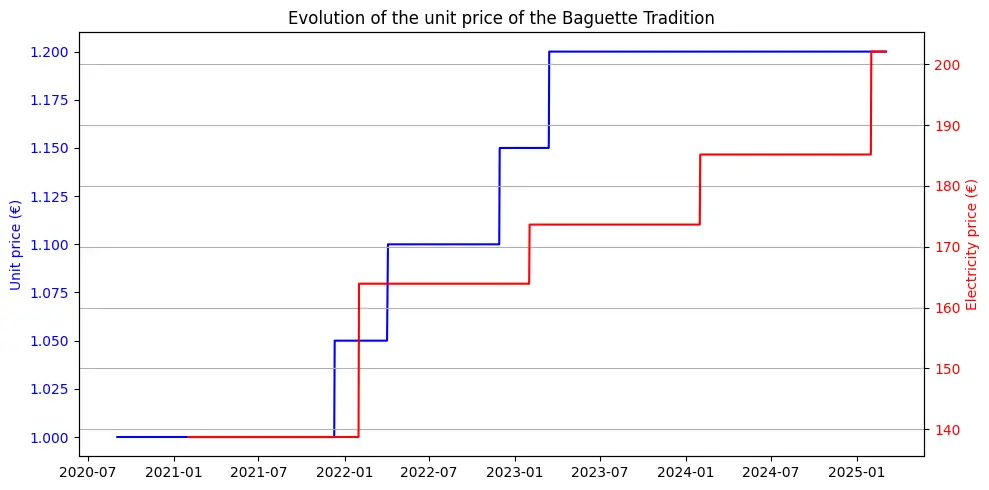
This suggests that persistent increases in energy costs ultimately translate into higher product prices, even if the impact is not immediately observed.
Unexpectedly, local unemployment rates demonstrated an inverse relationship with the price of traditional baguettes, as illustrated in the following graph:
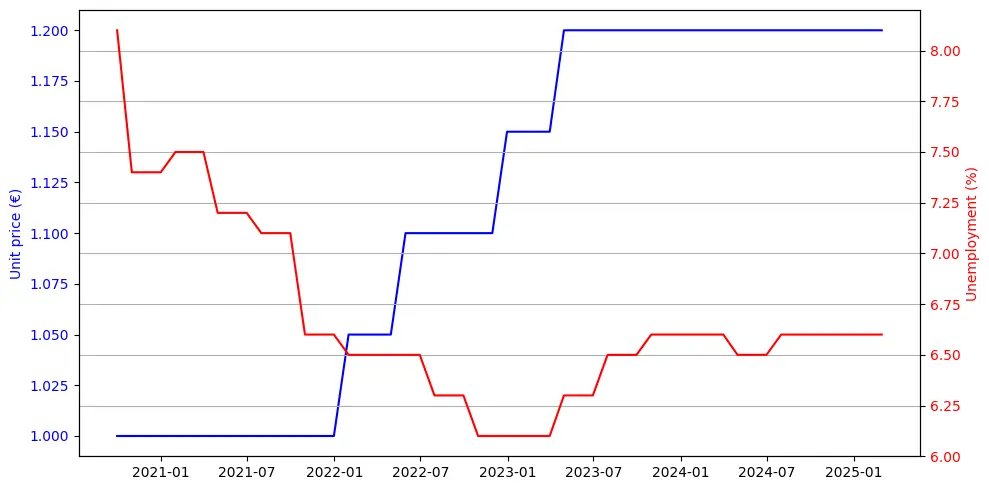
While counterintuitive at first glance, this phenomenon may reflect socioeconomic dynamics wherein increased unemployment reduces consumer spending power, thereby limiting the extent to which bakeries can increase prices without negatively affecting sales volumes.
These findings underscore the multifactorial nature of price determination within the bakery sector, where both macroeconomic indicators and local socioeconomic conditions shape pricing strategies. Further investigation may involve modeling the combined effects of multiple variables to quantify their relative contributions and interactions, particularly in the context of economic variability and market constraints.
Creating a Sales Prediction Model
To forecast future sales, the analysis focused on traditional baguettes, a key revenue driver for the bakery. In this section, I tried to create a sales prediction model using machine learning techniques. The goal was to identify factors influencing sales dynamics and develop a predictive model capable.
Dataset Creation
The dataset was constructed from the original transaction records, retaining only the entries related to traditional baguette sales. Subsequently, the data were aggregated on a daily basis by summing the quantities sold, thereby producing a time series of daily baguette sales.
To capture the impact of public events and social context, binary variables were introduced to indicate public holidays, school vacation periods, and confinement days associated with the COVID-19 pandemic.
Economic indicators were obtained from authoritative sources, including the INSEE (Institut National de la Statistique et des Études Économiques). These variables included the Consumer Price Index (CPI) for food, local unemployment rate, and the minimum wage (SMIC). Furthermore, meteorological data were gathered from Meteo60, allowing the incorporation of variables such as average temperature, precipitation, and sunshine duration. To facilitate automated data retrieval, a script was developed to collect and compile monthly weather data into a consolidated dataset.
Feature Engineering
To improve the model's predictive performance, extensive feature engineering was performed to extract meaningful information from the raw data. The primary goal was to capture temporal dynamics, contextual influences, and interactions between variables.
Temporal features were derived from the transaction date, including the year, month, day of the month, week of the year, season and day of the week.
Lagged variables were incorporated to capture autocorrelation and temporal dependencies in sales. Specifically, lagged
sales quantities for the previous day (Lag1) and the previous week (Lag7) were computed. To smooth out short-term
fluctuations and highlight broader trends, moving averages over 7 days (Rolling_Mean7) and 30 days (Rolling_Mean30)
were
calculated.
Interaction features were engineered to better understand the combined effects of multiple factors. For instance, the
interaction between temperature and precipitation (Temp_Rain) was computed to capture weather conditions affecting
foot
traffic. Similarly, the combination of seasonality and temperature (Season_Temp) aimed to reflect seasonal climate
variations.
These engineered features significantly enriched the dataset, allowing the model to leverage a wide array of contextual and temporal information. This comprehensive approach enhanced the model's ability to detect patterns and relationships, ultimately leading to more accurate sales predictions.
Model Design
Initially, a transformer-based model was considered for sales prediction due to its ability to capture long-range dependencies. However, after conducting preliminary experiments, it became evident that a simpler Long Short-Term Memory (LSTM) model not only provided better performance but also required significantly less computational time.
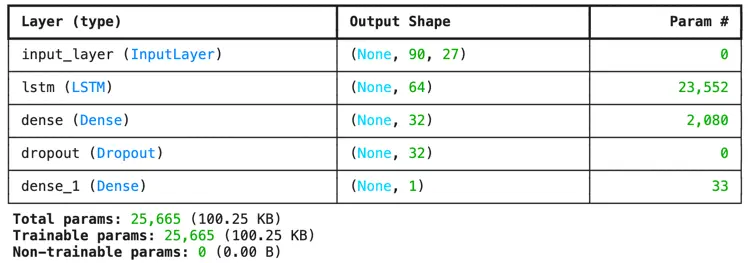
The chosen LSTM model architecture consisted of an LSTM layer with 64 units to effectively capture temporal patterns within the sales data. Following this recurrent layer, a dense layer with 32 units and a ReLU activation function was added to introduce non-linearity and enhance feature representation. To mitigate overfitting, a dropout layer was incorporated, randomly deactivating a fraction of neurons during training. Finally, an output dense layer with a single unit was employed to generate the predicted daily sales quantity.
The model was compiled using the Adam optimizer, known for its adaptive learning rate and computational efficiency,
coupled with the Mean Squared Error (MSE) loss function to quantify prediction errors. The training process utilized
80% of the dataset, reserving the remaining 20% for model evaluation. The data were standardized before training to
ensure
numerical stability and faster convergence.
This design choice proved to be a pragmatic balance between model complexity and predictive performance, favoring a lightweight architecture capable of capturing essential temporal dynamics without excessive computational overhead.
Results
The predictive model exhibits a relatively high error rate due to the inherent variability in the daily sales of
traditional baguettes. Forecasting sales with high precision remains a challenge given the fluctuations observed in
consumer purchasing patterns. The Mean Absolute Error (MAE) for the model stands at 26.49%.
However, after the exclusion
of outlier values, the MAE decreases to 23.75%, though it remains substantial. This suggests that the model struggles
to
capture extreme variations in sales.
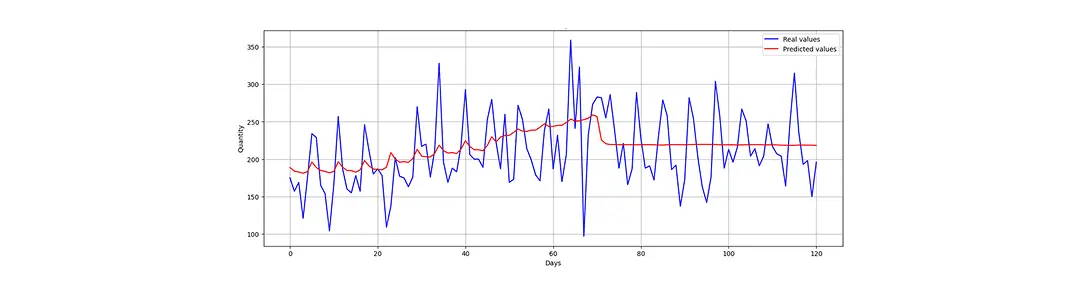
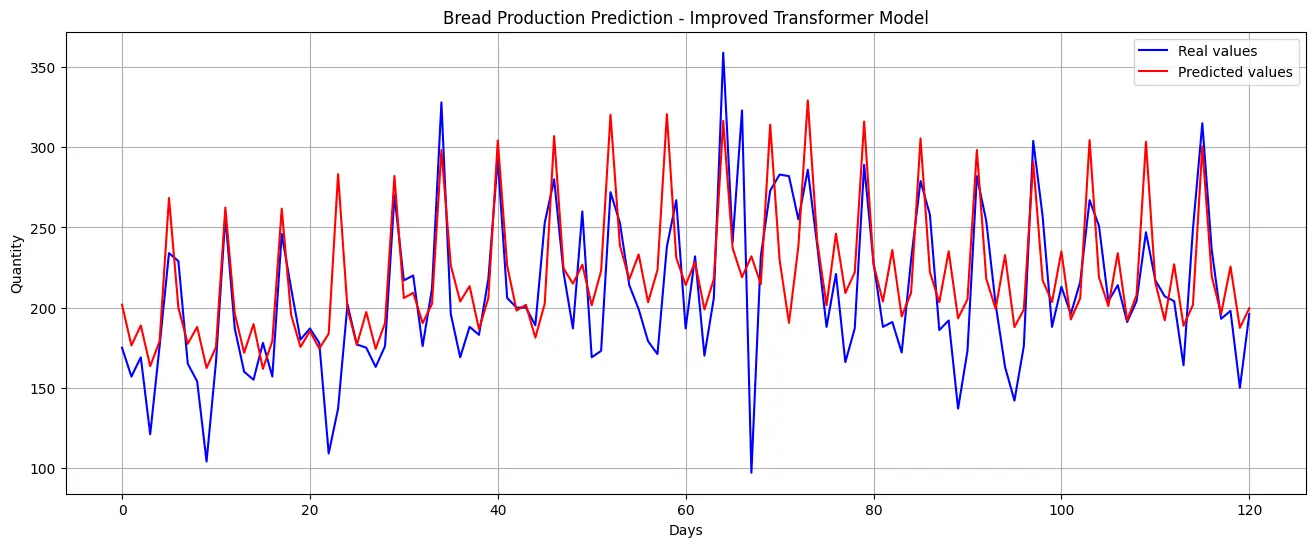
The visual comparison of predicted and actual sales reveals that while the model encounters difficulties in precisely estimating sales figures, it successfully captures general trends. As demonstrated in the following figure, the model can approximate overall patterns but lacks the granularity to predict short-term fluctuations with accuracy.
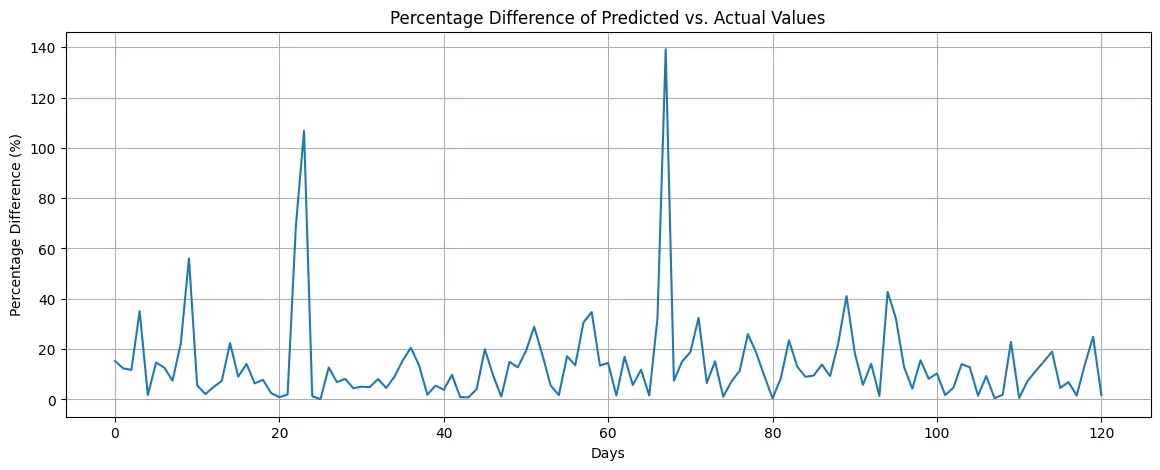
Further analysis of the prediction errors highlights the model’s limitations in estimating sudden sales variations. The distribution of residuals demonstrates inconsistencies, reinforcing the challenge of forecasting abrupt demand changes.
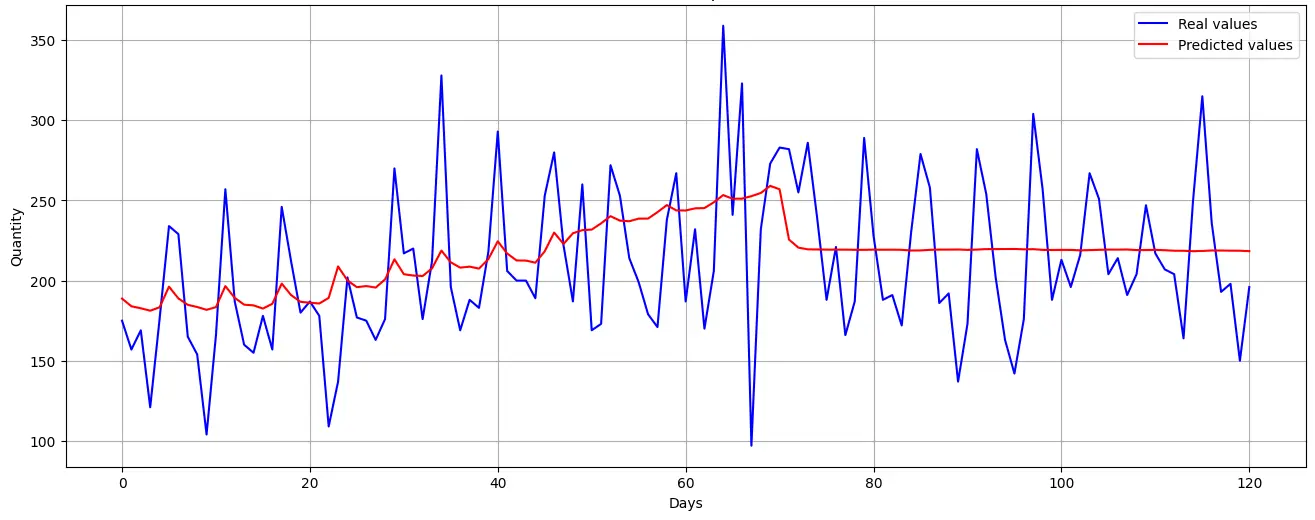
An alternative modeling approach that prioritizes trend prediction over absolute sales values yields improved performance. By restructuring the model to identify sales trajectory rather than exact values, it aligns more closely with observed variations, suggesting potential applications in inventory management and supply chain adjustments rather than precise forecasting.
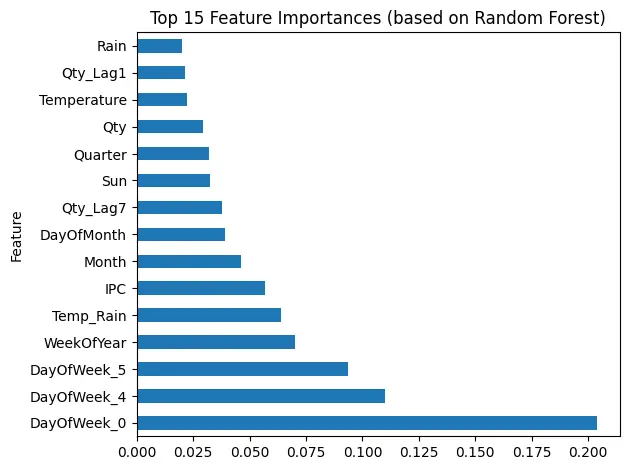
To further interpret the model’s behavior, a feature importance analysis was conducted using a Random Forest algorithm. The analysis identified temporal variables as the most influential predictors, followed by meteorological conditions and the Consumer Price Index (CPI) for food products.
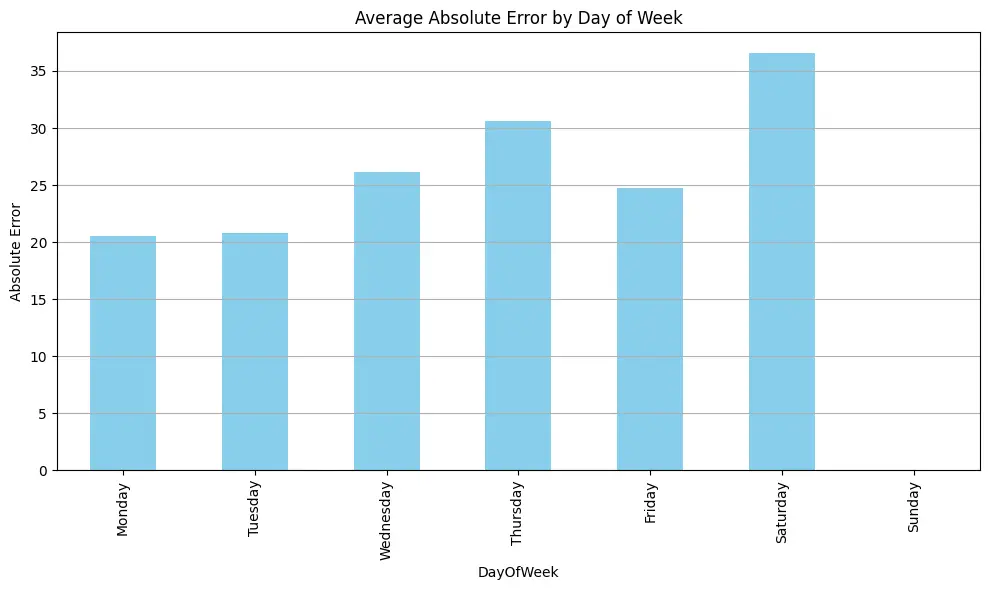
Additionally, an evaluation of the model’s predictive accuracy across different days of the week reveals that errors are disproportionately higher on weekends. This discrepancy suggests that consumer behavior exhibits increased variability during these periods, possibly due to factors such as special events or shifts in purchasing routines.
Overall, while the model is constrained in its ability to generate precise short-term sales forecasts, it proves useful in identifying broader consumption patterns and underlying influences on sales dynamics. Future improvements could integrate external variables such as local events or socioeconomic indicators to enhance predictive reliability.
Conclusion
Customer purchasing behavior follows clear patterns, with staple bakery items driving sales and economic factors influencing pricing. Clustering analysis revealed distinct purchasing habits, supporting targeted marketing and inventory management. While the sales prediction model successfully captures overall trends, short-term fluctuations remain difficult to forecast. Enhancing the model with real-time external data and refining product recommendations can further improve accuracy, optimize operations, and enhance the customer experience.